The Issue of P-Value Hacking and Its Impact on Research Integrity
methods
statistics
p-hacking
The strict use of a fixed 5% p-value threshold has led to a major problem in scientific research: p-value hacking. This phenomenon refers to the excessive exploration of data or performing multiple analyses to find a “statistically significant” result (e.g., a p-value below 0.05). This practice is problematic because it increases the likelihood of false positive results that appear significant but do not reflect a true effect.
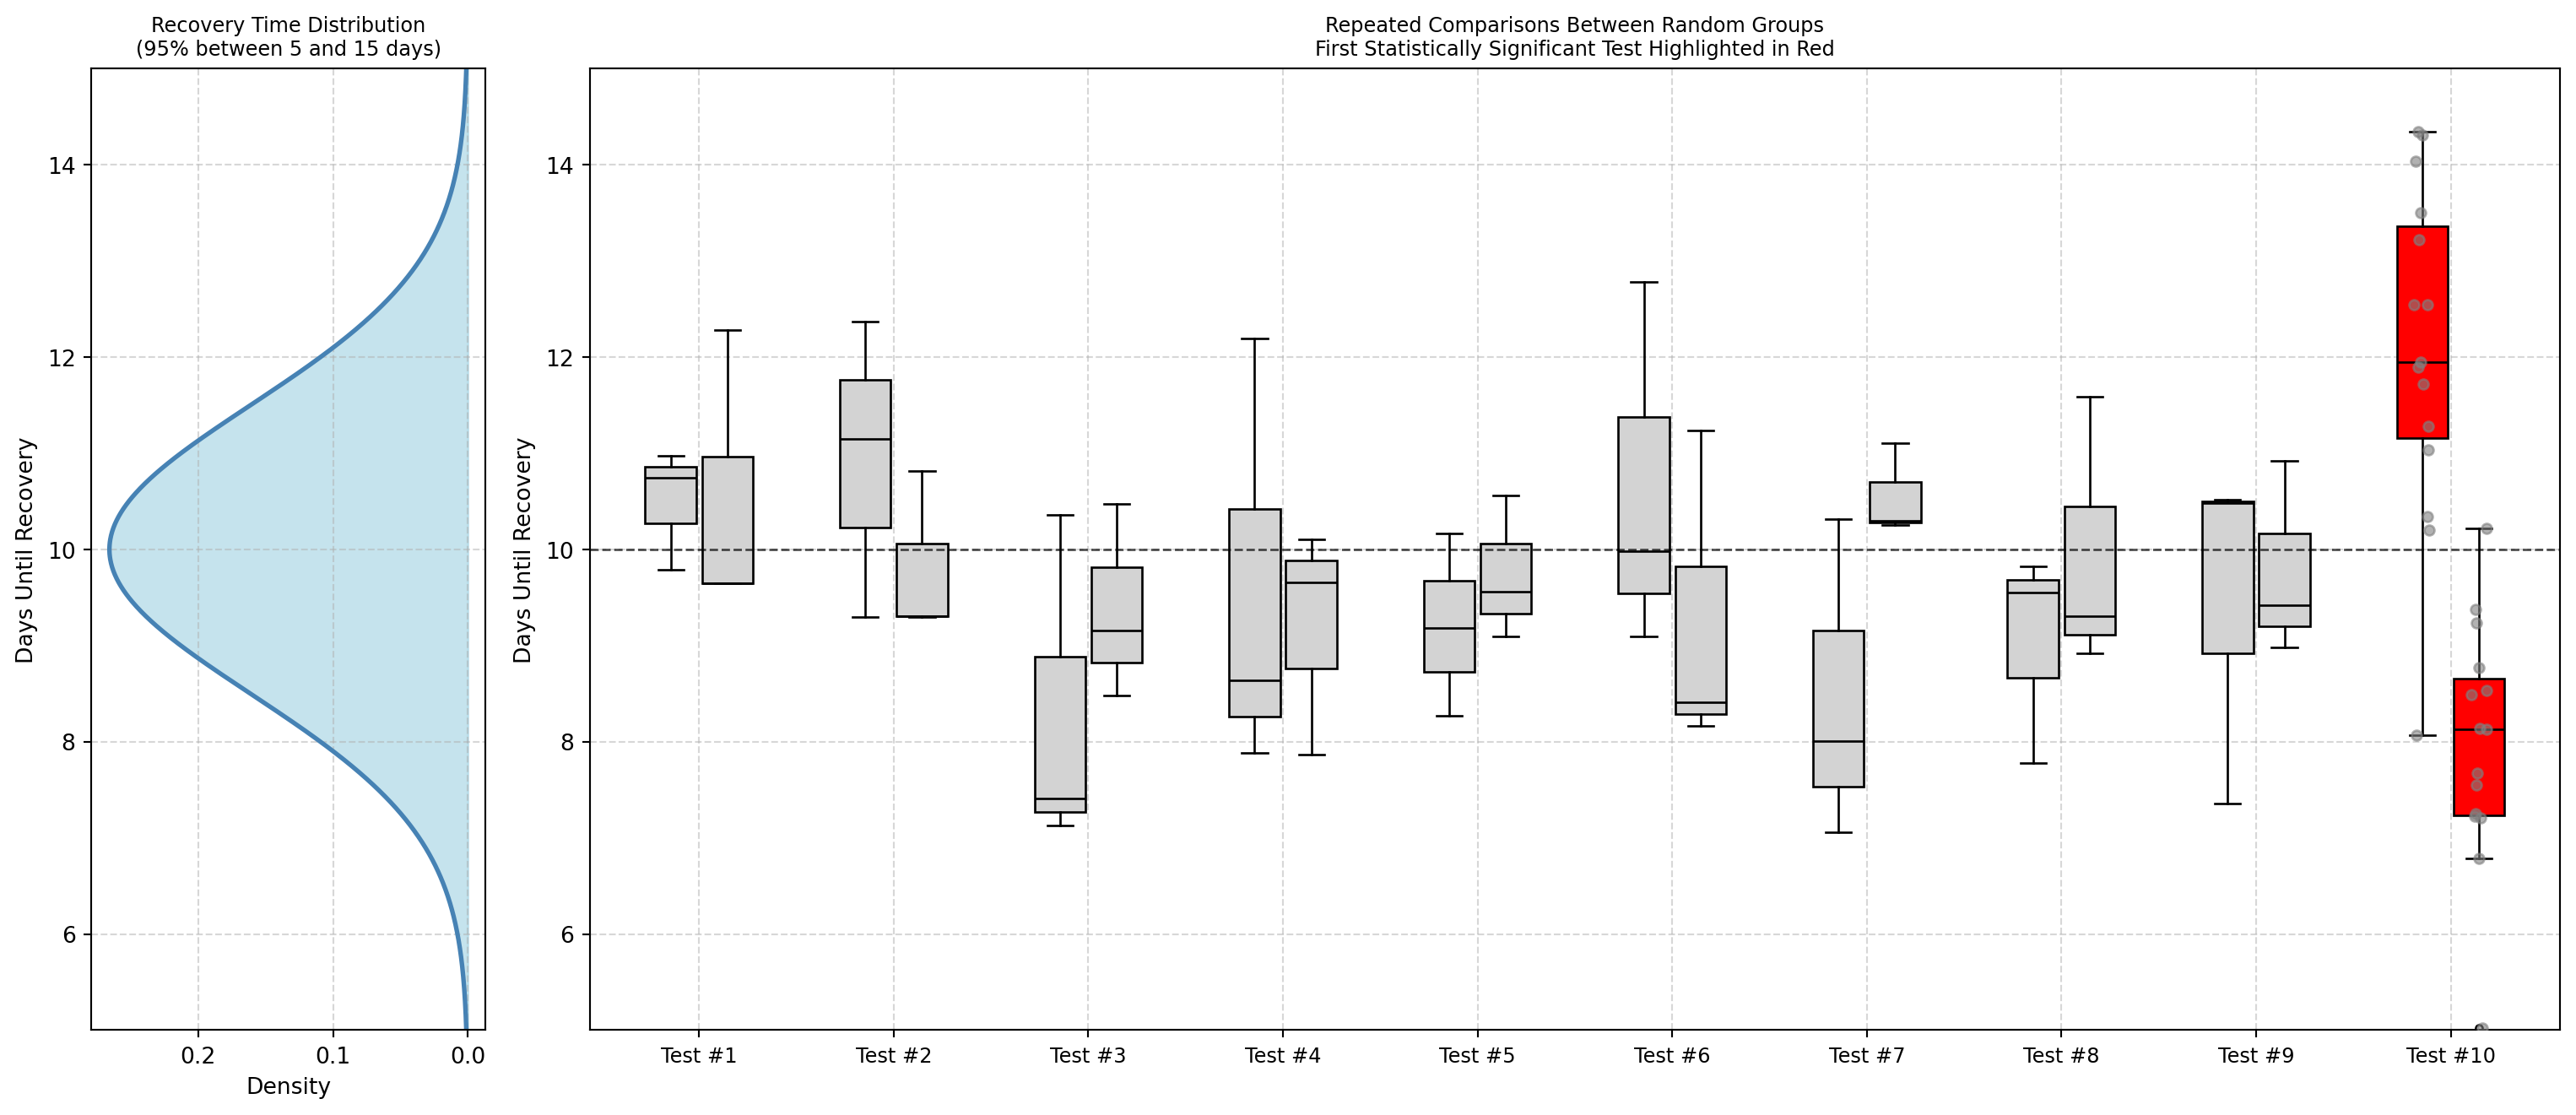
Let us consider, as an example, measuring the recovery time for a group of individuals who have not taken any drug to combat a virus. Suppose that 95% of individuals recover within a time window ranging from 5 to 15 days. We randomly select two groups (from the same distribution), each with three observations, and compare their recovery times. We know that if we repeat this comparison 100 times, there’s a 5% chance of obtaining a false positive; that is, finding a statistically significant difference purely by chance. If we repeat the same procedure 10,000 times, we could expect around 500 false positives. In other words, the more tests of this kind we perform, the higher the likelihood of observing at least one false positive result.
This phenomenon, where conducting many statistical tests increases the chance of false positives, is known as the Multiple Testing Problem.
There are many ways to compensate for the Multiple Testing Problem and reduce the number of false positives, for example, the False Discovery Rate. The general idea behind the False Discovery Rate (FDR) approach is to compute the p-value for each comparison and then calculate an adjusted p-value, which is usually larger than the original one. As a result, some of the tests that were initially statistically significant may now have an adjusted p-value greater than 5%.
Let us imagine that Test #10 in the graph above, highlighted in red, has a p-value of 6%. Typically, when performing a statistical test, we do not know in advance whether the data from the two groups come from the same distribution or two different distributions. Honestly, we always hope, in our experiments, that the observations come from two different distributions. Remember that, in this experiment, we are searching for a drug to help people recover fast, and if the p-value is 6%, we are very tempted to know if the p-value will get smaller if we add more data. However, the theory assumes that we only calculate a single p-value to make a decision, and to avoid making a mistake and getting a false positive, we need to determine the proper sample size before experimenting. That means we need to do a Power Analysis that tells us how many replicates we need to have a relatively high probability of correctly rejecting the null hypothesis.
p-value Hacking: an Example
When faced with a p-value hovering around 0.06 or 0.07, researchers often feel justified in collecting additional observations to better verify the effect they’re studying. While this approach might seem reasonable (we’re almost there or just a bit more data to see the effect clearly), it introduces a methodological bias into the research. In the scientific literature, researchers refer to this behaviour using several terms: optional stopping, data peeking or more commonly known as p-hacking.
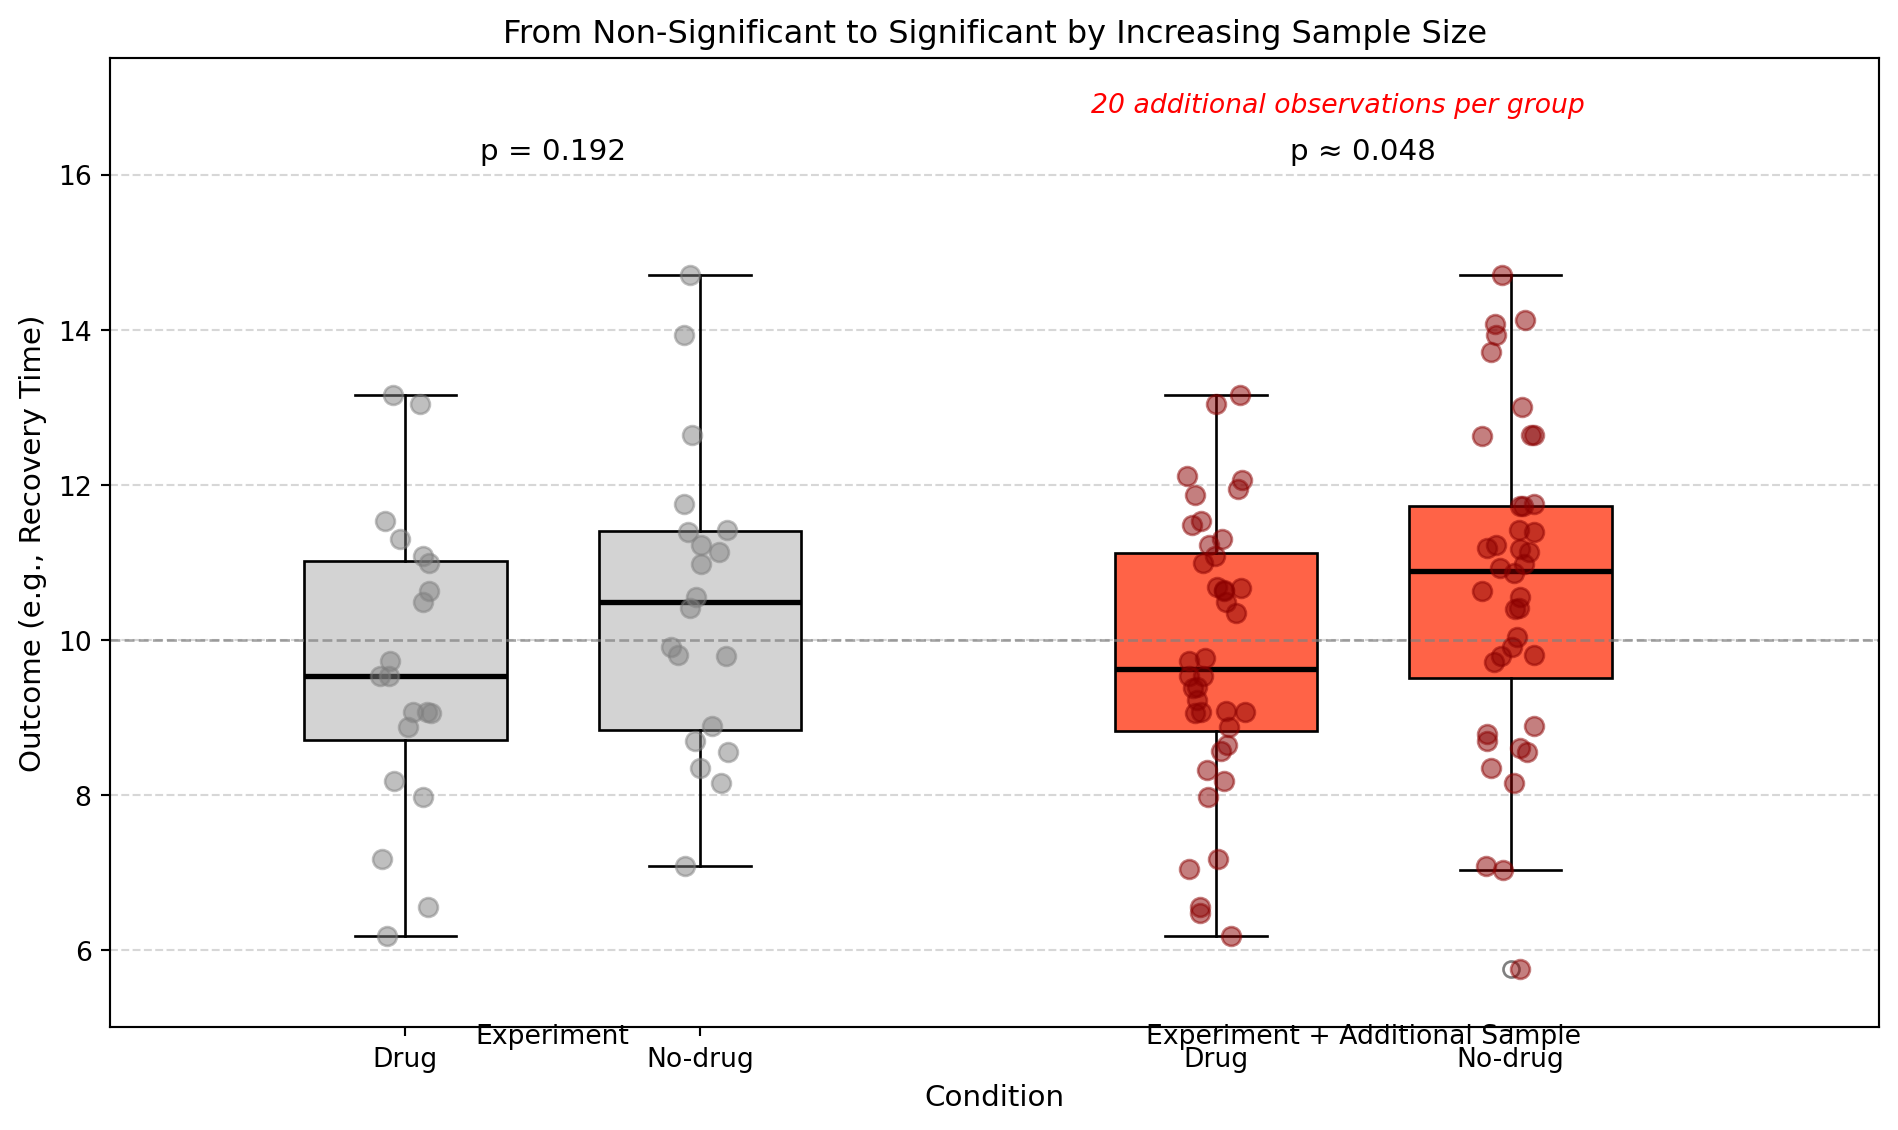
The graph above perfectly illustrates the concept of p-hacking. Here’s what happens: a researcher conducts a test and obtains a p-value of 0.06, which is not statistically significant by conventional standards. Instead of accepting this result, he decided to modify the study design, specifically by adding more observations. When he performed the analysis again with the additional data, he obtained a p-value below 0.05 and declared his finding significant.
Why P-Values Tend to Decrease as Sample Size Increases
When the sample size increases in statistical studies, p-values typically decrease, even when examining the same effect. This occurs because larger samples provide more precise estimates of group means, with random fluctuations (noise) balancing out more effectively. Consequently, statistical tests can detect smaller differences between groups.
Mathematically, this is evident in tests like the independent samples t-test, where:
\[t = \frac{\bar{X}_1 - \bar{X}_2}{SE}\]
where SE (standard error) is:
\[SE = \sqrt{\frac{s_1^2}{n_1} + \frac{s_2^2}{n_2}}\]
As sample sizes \(n_1\) and \(n_2\) increase, the standard error decreases, resulting in a larger t-statistic and smaller p-value, even when the observed difference \(\bar{X}_1 - \bar{X}_2\) remains constant.
This relationship creates an important caveat that must be emphasized: with very large samples, researchers can obtain statistically significant results (p < 0.05) even for minimal effects that have no practical relevance. The test becomes so sensitive that it detects differences too small to matter in clinical practice or policy decisions.
Therefore, when working with large datasets, researchers must distinguish between statistical significance and practical importance, complementing p-value interpretation with effect size measures to assess the actual relevance of their findings.
To address this issue, as an alternative, adopting flexible thresholds can be a viable solution by adjusting alpha levels based on the specific research context. Instead of relying on a fixed significance threshold, researchers should transparently justify their choice of alpha to ensure it aligns with the study’s objectives and methodological considerations. See the paper: Justify Your Alpha: https://doi.org/10.1038/s41562-018-0311-x
References and further resources
- Simmons, J. P., Nelson, L. D., & Simonsohn, U. (2011). False-Positive Psychology: Undisclosed Flexibility in Data Collection and Analysis Allows Presenting Anything as Significant. Psychological Science, 22(11), 1359–1366. https://doi.org/10.1177/0956797611417632
- Head, M. L., Holman, L., Lanfear, R., Kahn, A. T., & Jennions, M. D. (2015). The Extent and Consequences of P-Hacking in Science. PLOS Biology, 13(3), e1002106. https://doi.org/10.1371/journal.pbio.1002106
- StatQuest with Josh Starmer — YouTube channel: https://www.youtube.com/@statquest